_________________________
Bias Analysis Tool (BAT)
BAT is designed and developed by Dr. Ramesh Teegavarapu with the help of Dr. A. Goly to evaluate radar data using several visual, quantitative and statistical indices. It is can also be used for evaluation of hydrologic models and any simulation model-generated results. BAT can be used for forecast verification of precipitation forecasts available from National Weather Service (NWS). BAT consists of several error and performance metrics for evaluation of radar data at different temporal and spatial resolutions. BAT can be customized to client-specific requirements and expanded with additional features.
BAT will help to answer these questions:
What is the overall quality of the radar data compared to rain gage data (i.e., ground truth)?
Are the radar and rainfall data characteristics statistically similar?
What is the overall bias?
What is the error structure and how it is varying in space and time?
What is variability of the bias in space and time?
What is the skill of the method used for radar-based rainfall estimation in the definition of rain or no rain events?
Do the radar-based rainfall estimates preserve the site (at a rain gage location) and regional (a set of rain gages) statistics?
Are the rainfall fields generated by radar-based estimates and rain gage-based observations similar?
Can a specific index or a set of indices help provide directions to improve the radar-based rainfall data?
How do radar and rain gage data quantitatively compare at different temporal resolutions?
Is radar data quality appropriate for distributed hydrologic modeling?
BAT provides a comprehensive evaluation using:
Four association measures
Six quantitative error performance measures
Six skill scores
Six contingency measures
Six summary statistics
Three statistical tests
Six Proximity metrics
Multi-model/product evaluations
Uncertainty Assessment for performance measures
Assessment at multiple spatial resolutions
Modules:
The main modules in BAT are:
1. Data Input
A module to accept data in a specified format
2. Data Preparation
This module prepares the data set for analysis and check the data format and completeness
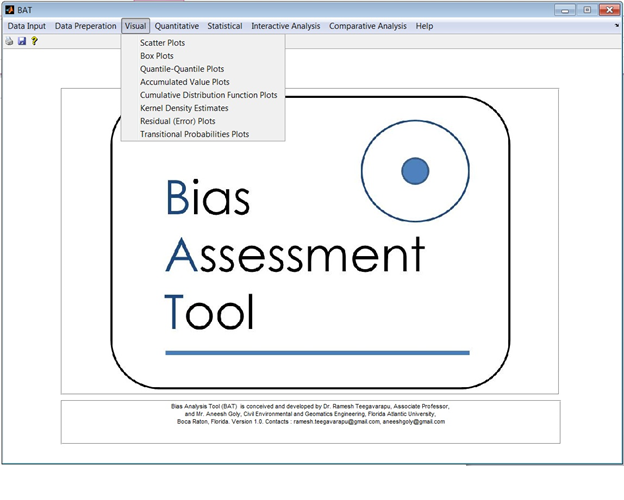
3. Visual
This is a non-interactive module for evaluation of visual indices
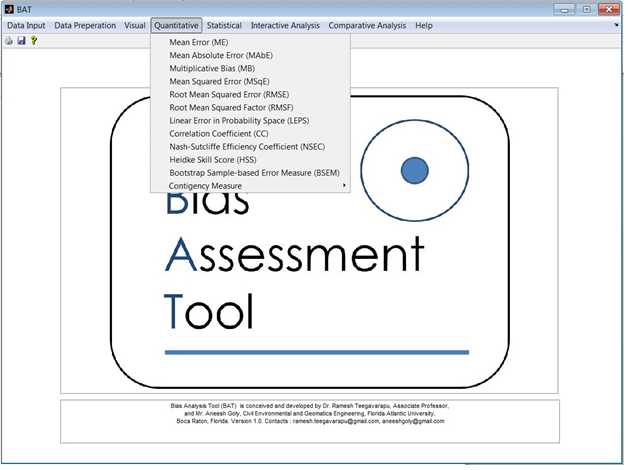
4. Quantitative
This is a non-interactive module for evaluation of quantitative indices
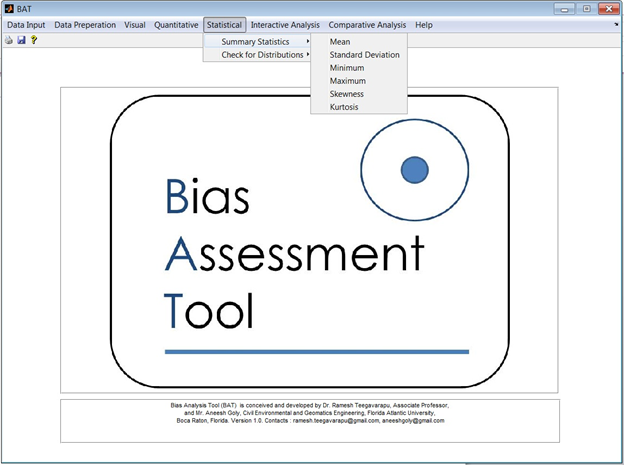
5. Statistical
This is a non-interactive module for evaluation of statistical indices
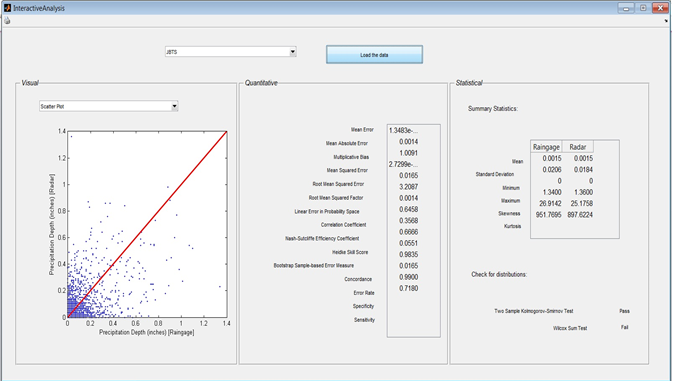
6. Interactive Analysis
This is an interactive module as the name suggests for all the three (visual, quantitative and statistical indices)
7. Comparative Analysis
This is again an interactive module with option of comparative analysis option (side-by-side) for all indices for two different temporal time frames.
8. Report
Generates two types of reports: Tabular and Graphical for the data selected in the “Data Preparation” module.
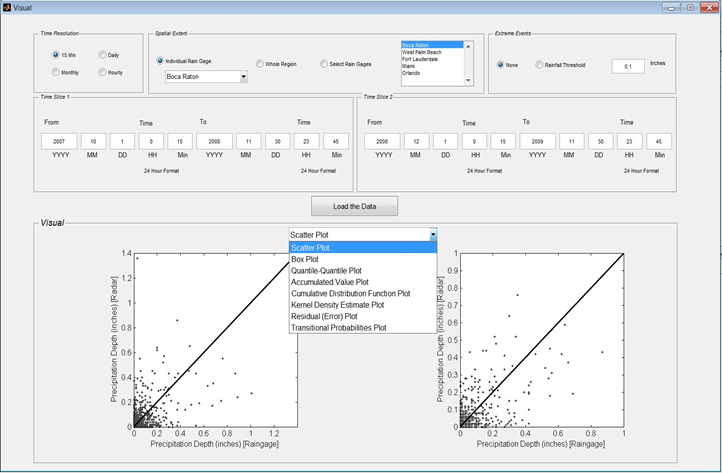
Visual
BAT consists of multiple visual assessment measures for assessment of data.
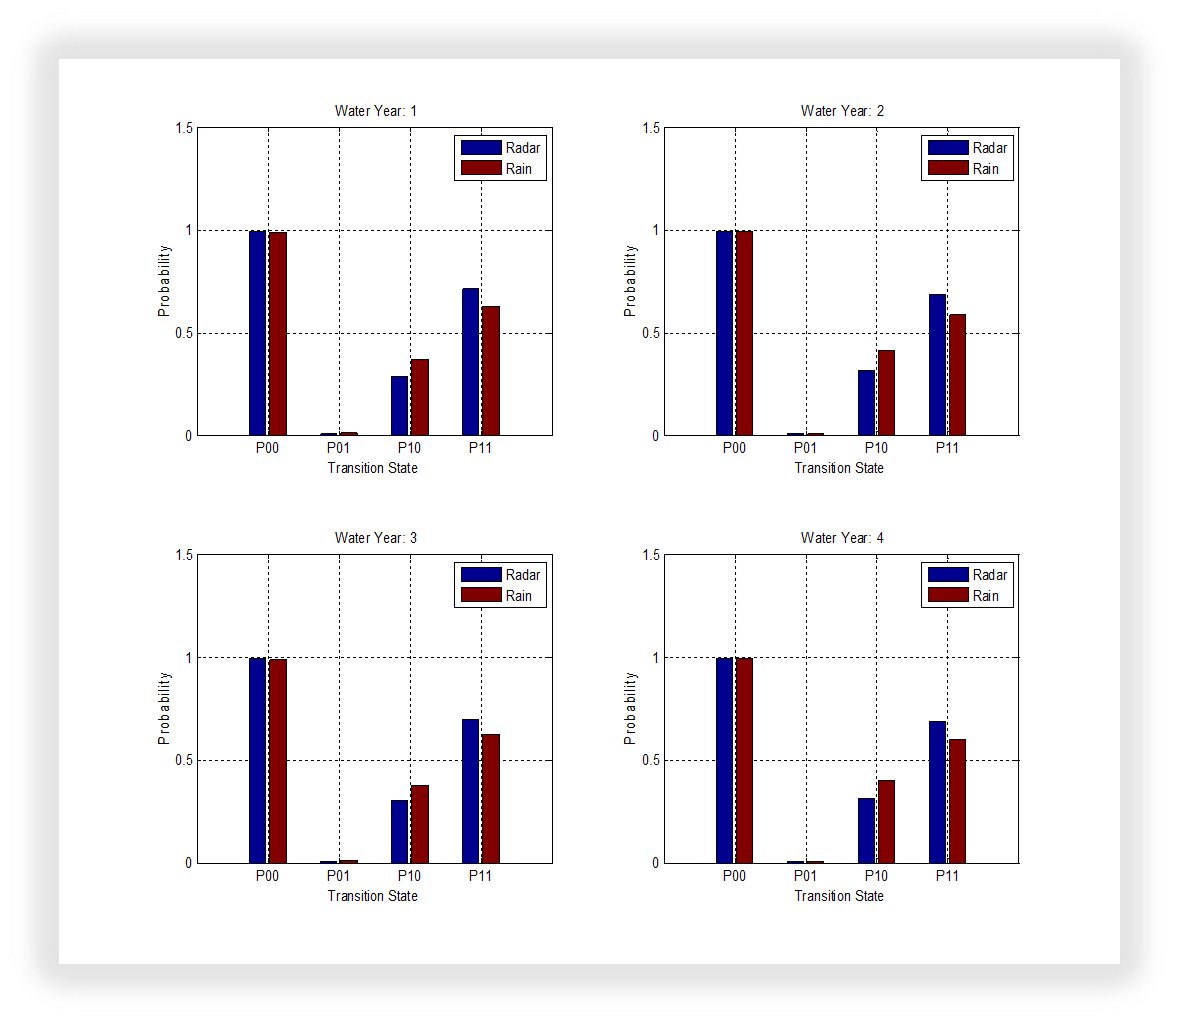
Scatter plots, Box plots, Quantile-Quantile plots, Accumulated Value plots, Cumulative Distribution Function Plots, Kernel Density Plots, Residual Plots, Transitional Probability Plots.
Quantitative
Error Measure: Mean Error (ME), Mean Absolute Error (MAE), Multiplicative Bias (MB), Mean Squared Error (MSE), Root Mean Squared Error (RMSE), Linear Error in Probability Space (LEPS), Correlation Coefficient (CC), Nash-Sutcliffe Efficiency Coefficient (NSCE), Hiedke Skill Score (HSS), Bootstrap sampling-based Error Measure (BSEM),
Contingency Measures: Sensitivity, Error Rate, Specificity, Concordance
Statistical
Summary Statistics: Mean, Standard Deviation, Minimum value, Maximum value, Skewness, Kurtosis. Check for Distributions: Kolmogorov-Smirnov (two sample test), Ansari Bradley Test, and Wilcoxon Test
Interactive Analysis
In interactive analysis mode, BAT can be used by the user to select visual, quantitative and statistical metrics to evaluate data at a site or multiple sites.
Comparative Analysis
In comparative analysis mode, BAT can be used by the user to select two temporal windows for assessment of data for single or multiple sites.
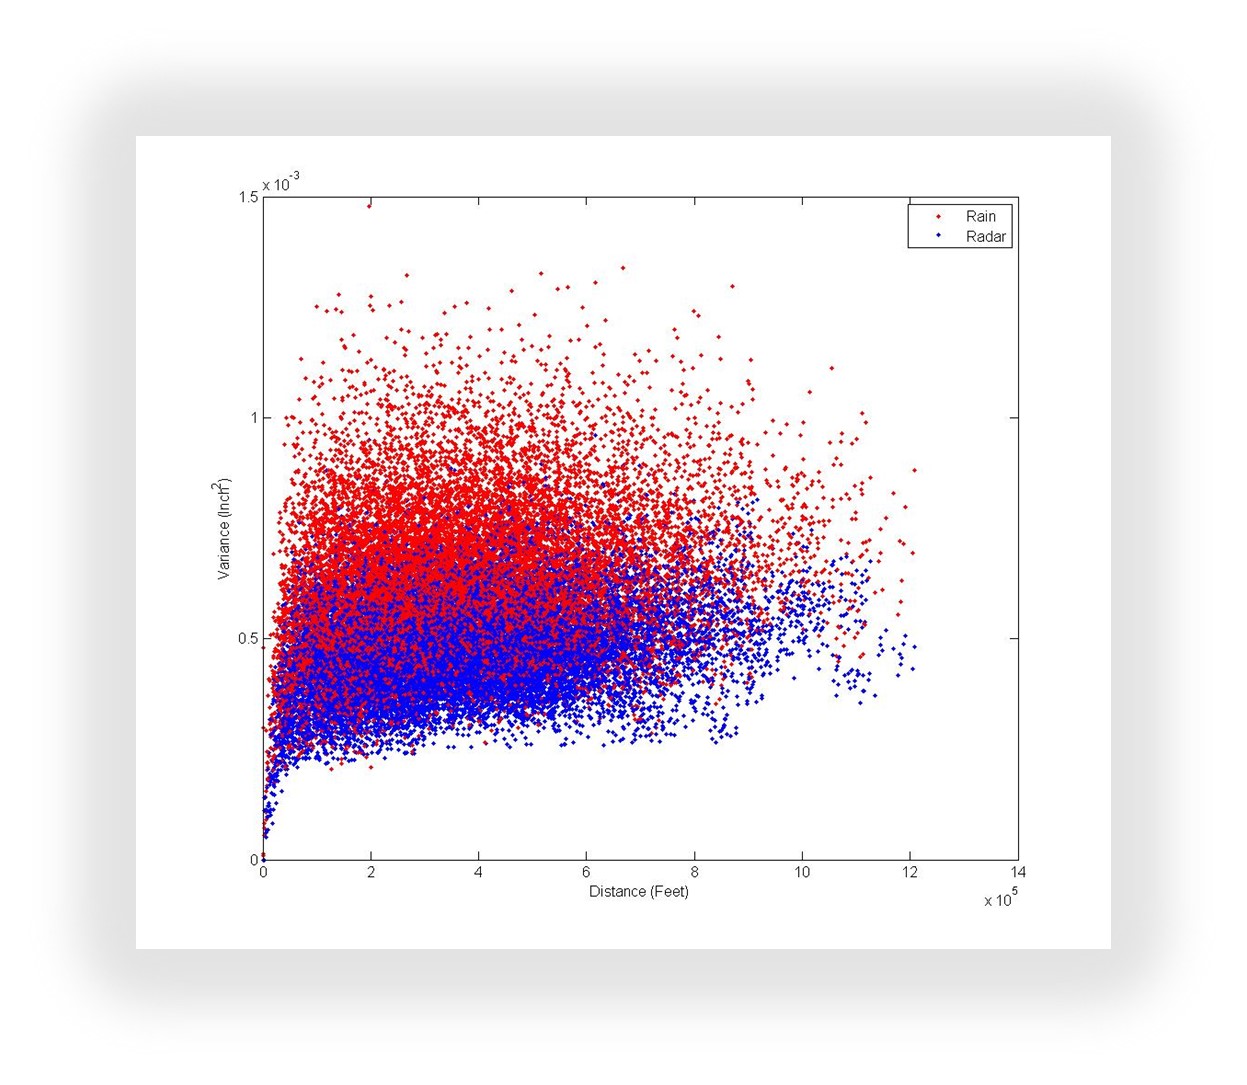
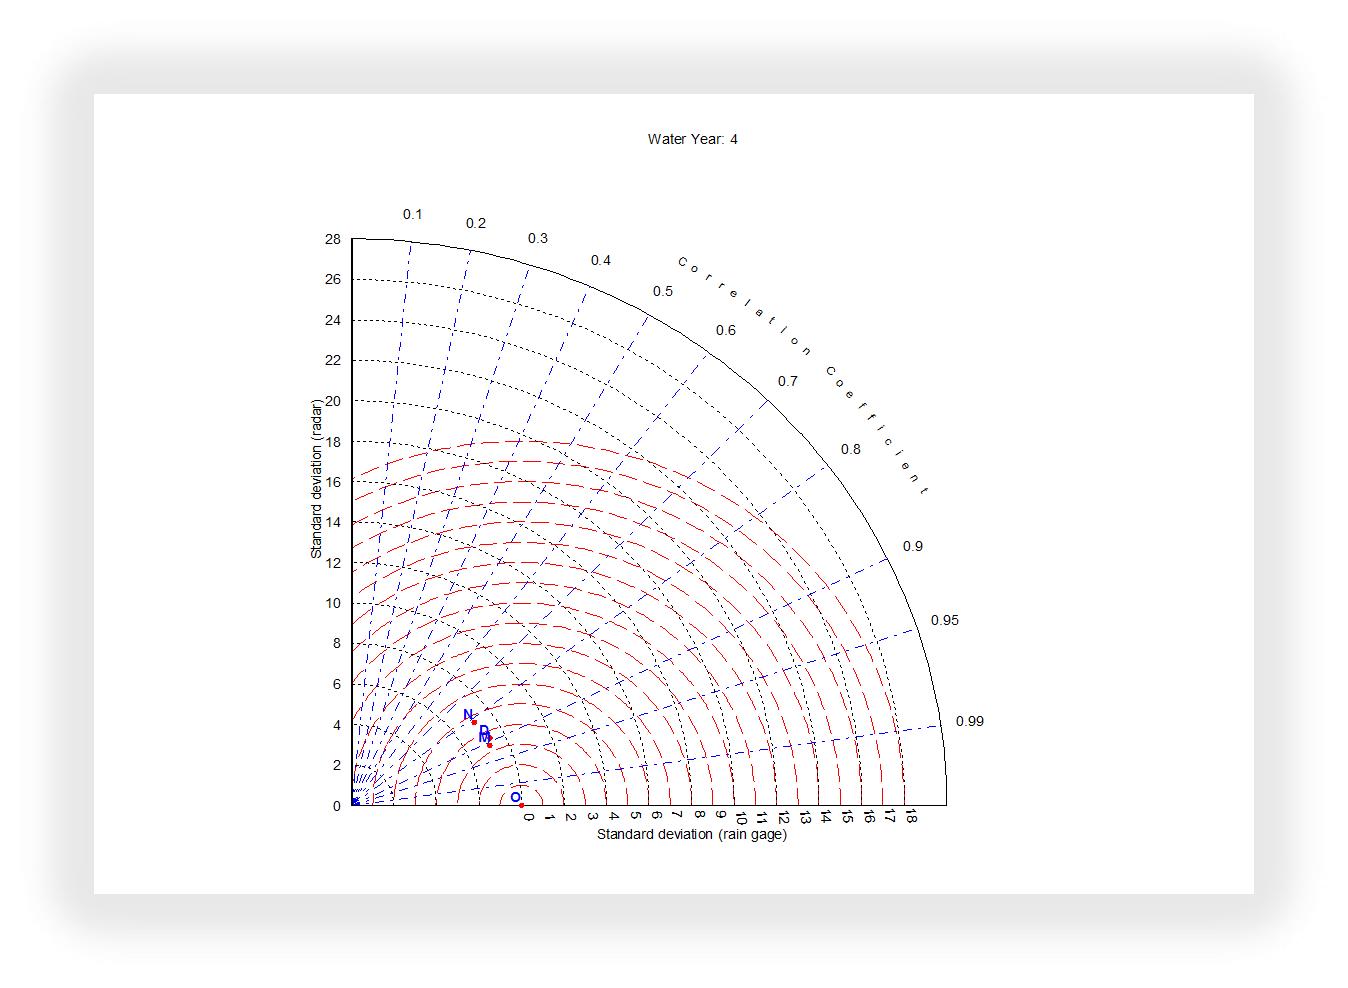
A few graphical results from BAT
Variogram clouds provide details about the spatial dependence.
Multi-model/product comparisons in one diagram with three error statistics
_________________
For more details please contact Dr. T. at rteegava@fau.edu